Tracked shipping to South Africa with premium packaging for just R199 

Ship to
South Africa
0
  • argentina
  • chile
  • colombia
  • españa
  • méxico
  • perú
  • estados unidos
  • internacional

Select your country

Americas

Europe

Rest of the world

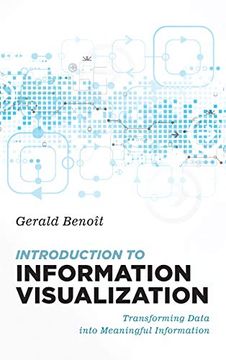
portada Introduction to Information Visualization: Transforming Data Into Meaningful Information
Type
Physical Book
Year
2019
Language
English
Pages
224
Format
Paperback
Dimensions
22.6x15.2x1.5 cm
Weight
0.36 kg.
ISBN13
9781538118351

Introduction to Information Visualization: Transforming Data Into Meaningful Information

Gerald Benoit (Author) · Rowman & Littlefield Publishers · Paperback

Introduction to Information Visualization: Transforming Data Into Meaningful Information - Benoit, Gerald

New Book Imported to South Africa
Delivery: 05 Oct - 14 Oct Shipping: 4 to 6 business days.
R 1,231
R 1,231

Synopsis "Introduction to Information Visualization: Transforming Data Into Meaningful Information"

Introduction to Information Visualization: Transforming Data into Meaningful Information is for anyone interested in the art and science of communicating data to others. It shows readers how to transform data into something meaningful - information. Applying information visualization in research, service, teaching, and professional life requires a solid understanding of graphic design and the aesthetic along with hands-on skills and knowledge of data principles and software. This book is applicable to students in all domains, to researchers who need to understand how to create graphics that explain their data, and to professionals and administrators for professional development training. Website Designers and Human-Computer Interaction researchers will appreciate the backstory of designing interactive visualizations for the web. Drawing on the author's years of practice and teaching, it bridges the two worlds in ways everyone can participate in the future of information and to appreciate the beautiful in information: Step-by-step directions in the fundamentals of HTML5, CSS, and d3.jsDesign challenges with fully explained answersWeb-site support for code samples (JavaScript, d3.js, python), live examples, and a place to build a community of other IV prosUseful for teaching design to scientists; data to the humanitiesGuidance for using the text depending on the class makeupReview of third-party visualization software, big data trends, and script librariesGuidance on how to continue in the IV world after graduation This full-color book features graphics and a companion Web site. The online companion site hosts living examples, updates, and errata. You're invited to participate on the site, too, sharing your questions, solutions, and ideas. For most readings, there is a partner design lab. At the conclusion of the course, there is a complete interactive information visualization service documentation for libraries.

Customers reviews

Frequently Asked Questions about the Book

All books in our catalog are Original.
The book is written in English.
The binding of this edition is Paperback.

Questions and Answers about the Book

Do you have a question about the book? Login to be able to add your own question.

Opinions about Bookdelivery

More customer reviews